The Ncaa has the Rpi, Espn developed the Bpi, and then there’s Kenpom‘s wonderland, with acronyms like NCSOS AdjEM. All these indexes are noteworthy but BasketballNcaa wanted to develop something different and unique, something that might help the growth of college basketball and increase its popularity. The goal here is not to rank the top 25 teams of the season, but to determine which team is the best among Mid-Majors. How? By combining games and data in a 64-teams board similar to the one used during March Madness.
Plenty of fans only follow big teams like Duke, Kentucky, Louisville, Kansas, North Carolina and the likes. But these teams are only a small part of the whole Division I, which includes 351 teams. Hence why you will not find those teams in the BasketballNcaa board. Following the lines of the most important website for Mid-Major teams, the eight most important conferences were not included and only the remaining twenty-four were considered. These remaining conferences often include almost unknown universities who rarely get to the national stage, if at all. Thanks to this board, they will play one against the other, from early in the season to the very end, a winner – and the best team among Mid-Majors – will be determined halfway through March. Here’s how it’s done.
Ranking
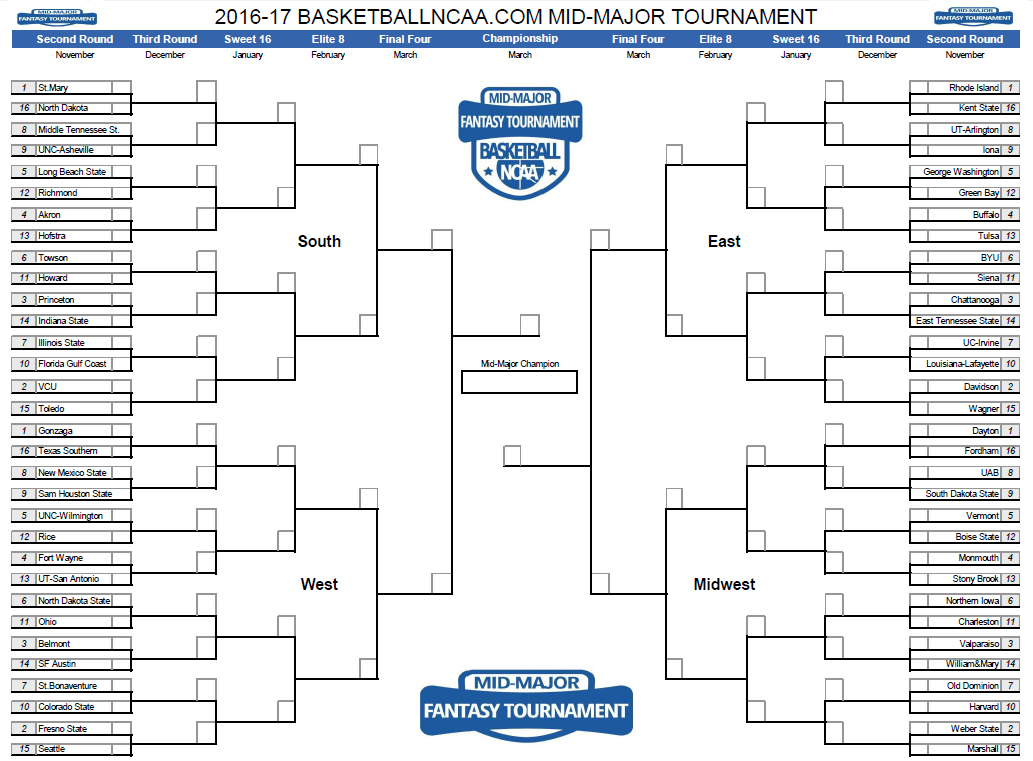
It begins with the usual 64-teams board divided into the usual four regionals. Every team will be ranked 1 through 16 based on BasketballNcaa Mid-Major ranking.
| POSITION | TEAM |
| 1 | St.Mary |
| 2 | Rhode Island |
| 3 | Dayton |
| 4 | Gonzaga |
| 5 | VCU |
| 6 | Davidson |
| 7 | Weber State |
| 8 | Fresno State |
| 9 | Princeton |
| 10 | Chattanooga |
| 11 | Valparaiso |
| 12 | Belmont |
| 13 | Akron |
| 14 | Buffalo |
| 15 | Monmouth |
| 16 | Fort Wayne |
| 17 | Long Beach State |
| 18 | George Washington |
| 19 | Vermont |
| 20 | UNC – Wilmington |
| 21 | Towson |
| 22 | BYU |
| 23 | Northern Iowa |
| 24 | North Dakota State |
| 25 | Illinois State |
| 26 | UC-Irvine |
| 27 | Old Dominion |
| 28 | St.Bonaventure |
| 29 | Middle Tennessee State |
| 30 | UT-Arlington |
| 31 | UAB |
| 32 | New Mexico State |
| 33 | UNC-Asheville |
| 34 | Iona |
| 35 | South Dakota State |
| 36 | Sam Houston State |
| 37 | Florida Gulf Coast |
| 38 | Louisiana-Lafayette |
| 39 | Harvard |
| 40 | Colorado State |
| 41 | Howard |
| 42 | Siena |
| 43 | Charleston |
| 44 | Ohio |
| 45 | Richmond |
| 46 | Green Bay |
| 47 | Boise State |
| 48 | Rice |
| 49 | Hofstra |
| 50 | Tulsa |
| 51 | Stony Brook |
| 52 | UT-San Antonio |
| 53 | Northern Colorado |
| 54 | East Tennessee State |
| 55 | William&mary |
| 56 | SF Austin |
| 57 | Toledo |
| 58 | Wagner |
| 59 | Marshall |
| 60 | Seattle |
| 61 | North Dakota |
| 62 | Kent State |
| 63 | Fordham |
| 64 | Texas Southern |
Scores
32 games will be played in the first round, 16 in the second, and so on. In order to calculate the final score of each team, every real game played in a certain period of time will be considered. Real monthly averages will be used to determine the final scores of the “fantasy” games, with the addition of small bonuses on specific occurrences, folllowing the chart below:
Schedule
Each monthly stretch will be linked to a specific round of the tournament:
First Round: every game played in November.
Round of 32: every game played in December
Sweet 16: every game played in January
Elite 8: every game played in February
Final 4: every game played in March up until the beginning of the Ncaa tournament.
Final: every game played throughout the season plus bonuses
Games
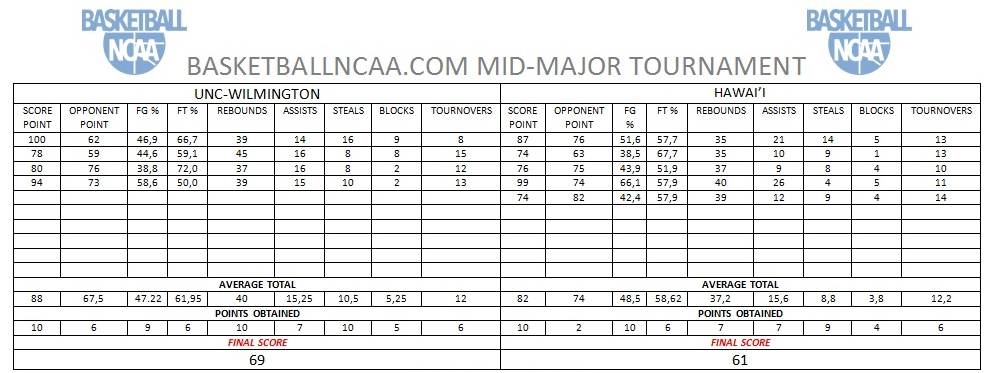
Here is a sample box score of a game between UNC Wilmington and Hawaii. This sample considers every real game played in November 2015 by the two teams.
Both averaged more than 80 points per game and they begin with the maximum points available (10) when factoring in their offensive production. However, Wilmington is a better defensive team (allowing 67.5 points per game) and gets another 6 points, while Hawaii (74 points per game allowed) gets only 2. They are even in field goal percentages and assists per game, but Wilmington is a better rebounding team (40 rebounds per game, worth 10 points) and at causing turnovers (10.5 steals per game, 10 points), while Hawaii is worse at rebounding (37.2 per game, 7 points) and in steals (8.8 per game, 9 points). Wilmington has 5 points when factoring in blocks per game and Hawaii has 4, and they both get 6 for their turnover averages.
The game mirrors as accurately as possible the real strength of the two teams, and Wilmington ultimately wins against Hawaii thanks to rebounding and defense, worth 7 of the 8 points that separates the two teams.
Tournament board
After an hopefully thorough explanation of how the games are “played”, let’s have a look at the official board of the tournament.
Big names like Gonzaga, Rhode Island, Dayton and St Mary’s will be ranked #1 in their respective regionals, but a couple of bad games might compromise the whole season, in this tournament just like in the real games. They are favorites on paper, but there are dangerous opponents, including 8th-seed UT-Arlington in the East playing Iona or 4th-seed Monmouth in the Midwest, who could do very well if the team can survive a difficult early schedule that sees them playing Syracuse and North Carolina. Princeton will be the 3rd seed in the South and will have to play Indiana State. It will also be worth to keep an eye on St Bonaventure with the 7th seed.
Every round will be introduced with a preview of the official schedule of every team, in order to project who will win every single game. The results of every round will be available on the first Sunday of every month. Who will be the best Mid-Major team of the year? Follow us and you’ll find out.
And if you want to fill out your own bracket or have a guess at which team will be in the Final Four, feel free to contact us at redazione@basketballncaa.com


